Как парсить (отфильтровать) логи IIS (веб сервера) вручную.
Как пропарсить (отфильтровать) логи IIS (веб сервера).
Для начала нужно узнать где лежат логи. Для IIS 6 логи обычно лежат по пути «C:\WINDOWS\system32\LogFiles\», все зависит от настроек, но по умолчанию логи именно там. Пуск (Start) — Мой компюьтер (My computer) — Управление (Manage) — Сервисы и приложения (Service and Applications) — Упраеление Веб сервером (Internet Information Services IIS manager) — Веб сайты (Web Sites) — Свойства (Properties). Откроется (Default Web Site Propirties): 
Далее нажать — Свойства (Properties) напротив Активного формата лога (Active log format). В строке Директория файлов лога (Log file directory) указан нужный нам путь. Те в этой папке хранятся логи нашего веб сервера.
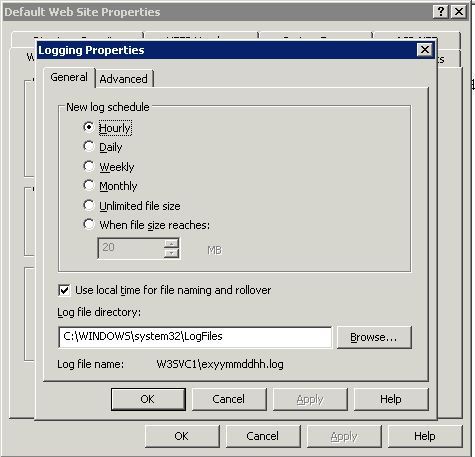
Можно скопировать данный путь и перейти в данную папку. Выбрать за нужную дату файлы, они хранятся в виде текстовых файлов с именами: exYYMMDDNN.log, где YY — год, MM-месяц, DD-день. 
Копируем нужные нам файлы в отдельную директорию. Создаем в этой же директории файл PPP.bat, со следующим содержимым:
find /I «name_site» *.* | find » POST » | find » 200 » >> resume.txt.
где, name_site — имя сайта или приложения, если он один нужно написать его название, например /site.ru
200 — статус успешно обработанного запроса. если нужно количество другого типа запросов например недоступности, то нужно проставить соответствующий статус, например 300, 500.
Скрипт сделает следующую работу: в каждом файле будет искать строку с именем сайта и соответствующим ему статусом, в конечном результате создастся в той же директории файл resume.txt, с размером сообщений и суммарным объёмом пройденного трафика.
Далее необходимо файл resume.txt, обработать в exel. Запускаем exel, переходим: Данные — Из текста: Выбираем файл resume.txt и нажимаем импорт.
 Открывается мастер импорта: выбираем с разделителями. Далее.
  Убираем все галки, кроме пробела. Далее.
 Дата: ГМД, готово.
Для получения статистики к последней колонке применяются формулы:
=SUM(№ первой ячейки:№ последней ячейки) сумма
=MIN(№ первой ячейки:№ последней ячейки) мин
=MAX(№ первой ячейки:№ последней ячейки) макс=AVERAGE(№ первой ячейки:№ последней ячейки) среднее.
Возможности журналирования и анализа логов в IIS 8.5
В новой версии Internet Information Services 8.5, представленной в качестве роли веб сервера в Microsoft Windows Server 2012 R2, появилась новая возможность логирования. IIS теперь может писать HTTP-логи в особый журнал трассировки через службу трассировки событий Windows (Event Tracing for Windows — ETW). Благодаря механизму Event Tracing for Windows в IIS 8.5 появилась возможность отслеживать события на веб сервере в реальном времени, что крайне полезно при отладке веб-приложений и поиске неисправностей.
В предыдущих версиях IIS логи веб-сервера записывались в отдельные лог-файлы. Основной недостаток данного механизма – кэширования логов в оперативной памяти. Логи из кэша записываются (сбрасываются) на диск каждую минуты или по достижению объема 64Кб. Это значительно усложняло онлайн-траблшутинг в IIS, т.к. высока вероятность того, что событие, появление которого вы ожидаете, произошло, но информация о нем пока просто не записалась в лог файл, и, соответственно, вы его не сразу не увидите.
В этой статье мы покажем, как в IIS 8.5 задействовать службу трассировки событий Windows (ETW) и как проанализировать полученные логи с помощью Microsoft Message Analyzer.
По умолчанию IIS 8.5 записывает логи в обычные тестовые файлы. Чтобы включить логирование через ETW, нужно в панели управления IIS (Internet Information Services Manager), выбрать имя сервера и в правой панели щелкнуть по значку Logging.
В окне настройки параметров журналирования в разделе Log Event Destination выберете метод ведения журнала, переключившись со стандартного Log file only на ETW event only. Обратите внимание, что можно включить ETW и стандартное журналирование IIS одновременно (Both log file and ETW event).  Сохраним изменения. Сразу после этого логи веб сервера IIS начнут писаться через службу трассировки событий Windows.
Для просмотра и анализа логов IIS в журналах ETW воспользуемся бесплатным инструментом Microsoft Message Analyzer, который можно скачать с сайта Microsoft по этой ссылке: _http://www.microsoft.com/en-us/download/details.aspx?id=40308
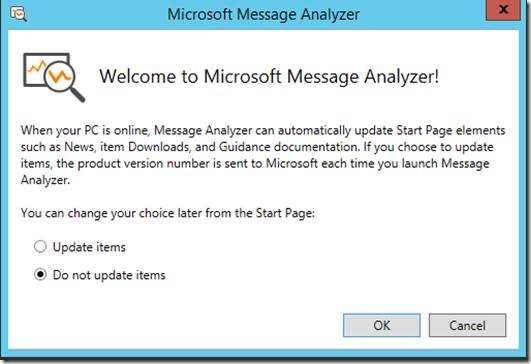
Во время первого запуска Microsoft Message Analyzer спросит, хотите ли вы обновить элементы на стартовом экране. Выберите желаемое действие.
В открывшемся окне Message Analyzer настроим доступ к логам IIS ETW. Для этого щелкните по ссылке Capture/Trace в левой колонке и укажите имя трассировки. 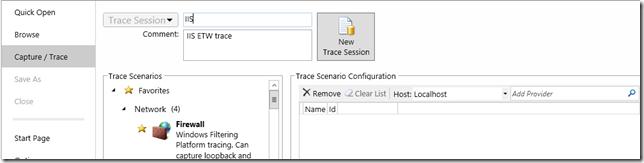
В разделе Trace Scenario Configuration в поле Add Provider введите IIS и из появившегося выпадающего списка выберите Microsoft-Windows-IIS-Logging. 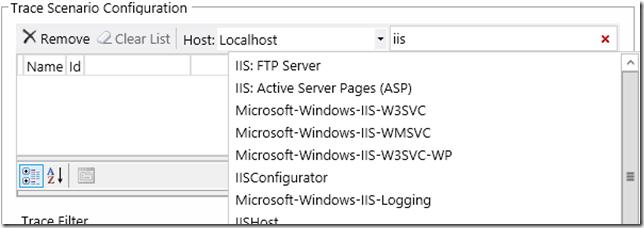
После того, как мы подключились к нужному провайдеру ETW, можно начать просмотр ( и сбор) событий, нажав кнопку Start With. 
Собранные данные будут отображены в виде таблицы (если эта опция была указана при запуске).
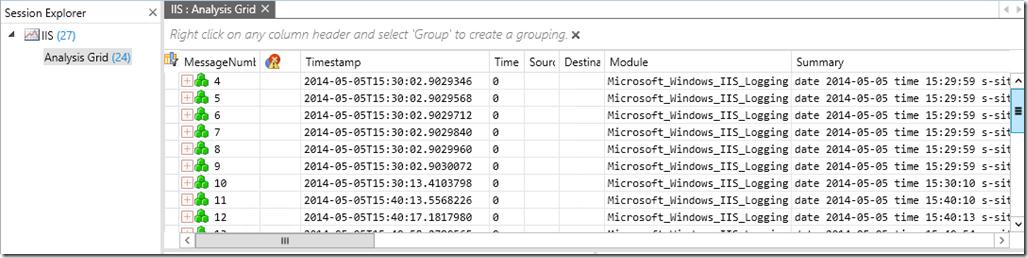
Чтобы уменьшить количество отображаемой информации, можно применять различные фильтры. Допустим, нам нужно вывести данные, касающиеся только определенного сайта IIS. 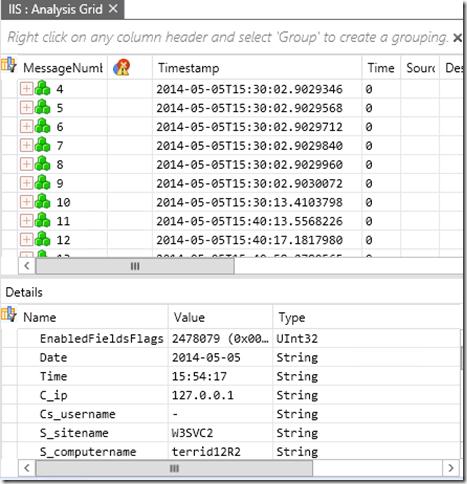
Для этого в расширенном описании нужного события щелкнем по полю S_sitename и выберем Add Ssitename To Filter (добавить имя сайта в фильтр). 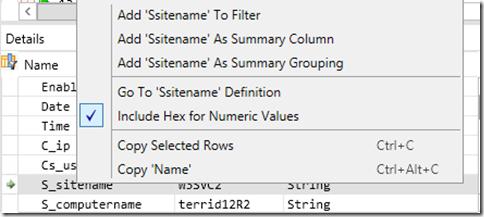
В окне фильтров появится сгенерированный текст кода фильтра. Если нажать кнопку Apply Filter, в окне журнала останутся только данные, которые относятся к указанному нами сайту. 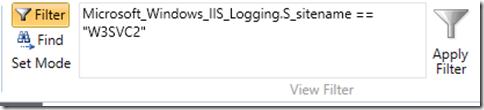
Аналогичным образом можно добавить фильтр, например, позволяющий оставить в журнале только события с ответом сервера 404 (поле Sc_status). 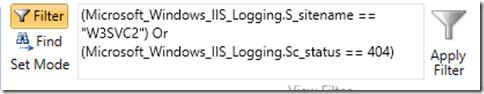
Итак, в этом небольшом обзоре мы разобрались с новыми возможностями анализа и поиска неисправностей на веб сервере IIS, с помощью журналирования событий веб-сервера через систему ETW. Также мы показали как можно анализировать полученных данных с помощью Microsoft Message Analyzer.
Где я могу найти журналы IIS?
Я пытаюсь настроить приложение от третьей стороны, для чего требуется поддерживающий веб-сайт, размещенный в моем локальном IIS. Я создал веб-сайт точно так, как описано в их руководстве по установке, но у меня возникли некоторые проблемы, и я хотел бы увидеть, что должен сказать журнал IIS. К сожалению, проблема в том, что я не могу найти файлы журнала!
Итак, мой вопрос: где IIS7 хранит журналы по умолчанию?
9 ответов
Я думаю, что это место по умолчанию для журналов доступа составляет
в противном случае проверьте в Диспетчере IIS, выберите компьютер на левой панели, а в средней панели перейдите в раздел «ведение журнала» в области IIS. Там вы увидите местоположение по умолчанию для всех сайтов (это, однако, переопределяется на всех сайтах)
вы также можете посмотреть в
который будет содержать аналогичные файлы журнала, представляющие только ошибки.
Я считаю, что это более простой способ узнать, где находятся ваши журналы IIS, а не просто предполагать местоположение по умолчанию:
перейдите на свой сайт IIS, например по умолчанию, нажмите на него, и вы увидите «Logging» справа, если ведение журнала включено:
откройте его, и вы увидите папку прямо там:
Я добавляю этот ответ, потому что после изучения интернета я оказался в этом ответе, но все еще не знал, какой папку папки журналов IIS для просмотра.
Если ваш сервер имеет несколько веб-сайтов, вам нужно будет знать идентификатор IIS для сайта. Простой способ получить это в IIS-просто нажать на сайты папка на левой панели. Идентификатор каждого сайта отображается на правой панели.
Как только вы знаете ID, давайте назовем его n, соответствующие журналы находятся в W3SVCn в папке IIS в папке logs. Итак, если Ваш идентификатор веб-сайта равен 4, скажем, и журналы IIS находятся в по умолчанию местоположение и журналы находятся в этой папке:
100% правильный ответ для расположения файлов журнала по умолчанию.
Да, вы можете ввести это в адресную строку проводника, она будет работать.
чтобы быть на 100% уверенным, вам нужно посмотреть журнал для веб-сайта в IIS.
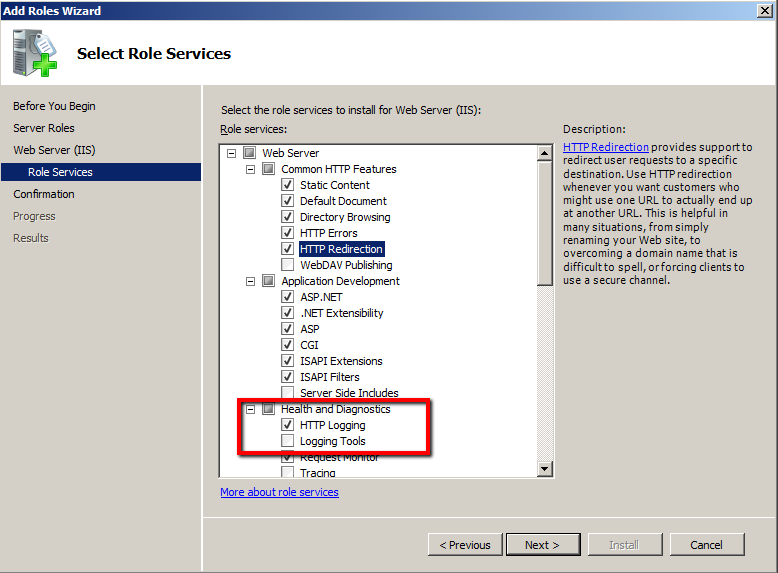
EDIT: как указал Энди в комментариях ниже, вам нужно убедиться при установке IIS, что вы решили включить ведение журнала HTTP, иначе ведение журнала HTTP не будет доступно.
гораздо проще сделать это с помощью PowerShell, например:
если вам просто нужна информация для себя и не против разбора результате в вашем мозгу :).
для бонусных очков, добавьте | ii к первой команде, чтобы открыть в проводнике, или | gci перечислить содержимое папки.
попробуйте журнал событий Windows, может быть какая-то полезная информация
включение трассировка может быть лучшей альтернативой журналу событий Windows. Это дало мне информацию, необходимую для исправления моего собственного веб-сервиса.
Я думаю, что место по умолчанию для ведения журнала IIS: c:\inetpub\wwwroot\log\w3svc
Я нашел файлы журнала IIS в следующем месте.
Where to Find IIS Log Files
Microsoft Windows Internet Information Services (IIS) log files provide valuable information about the use and state of applications running on the web. However, it’s not always easy to find where IIS log files are located to determine important aspects of app usage like when requests for servers were made, by whom, and other user traffic concerns.
IIS Logs Location
Where are IIS log files stored?
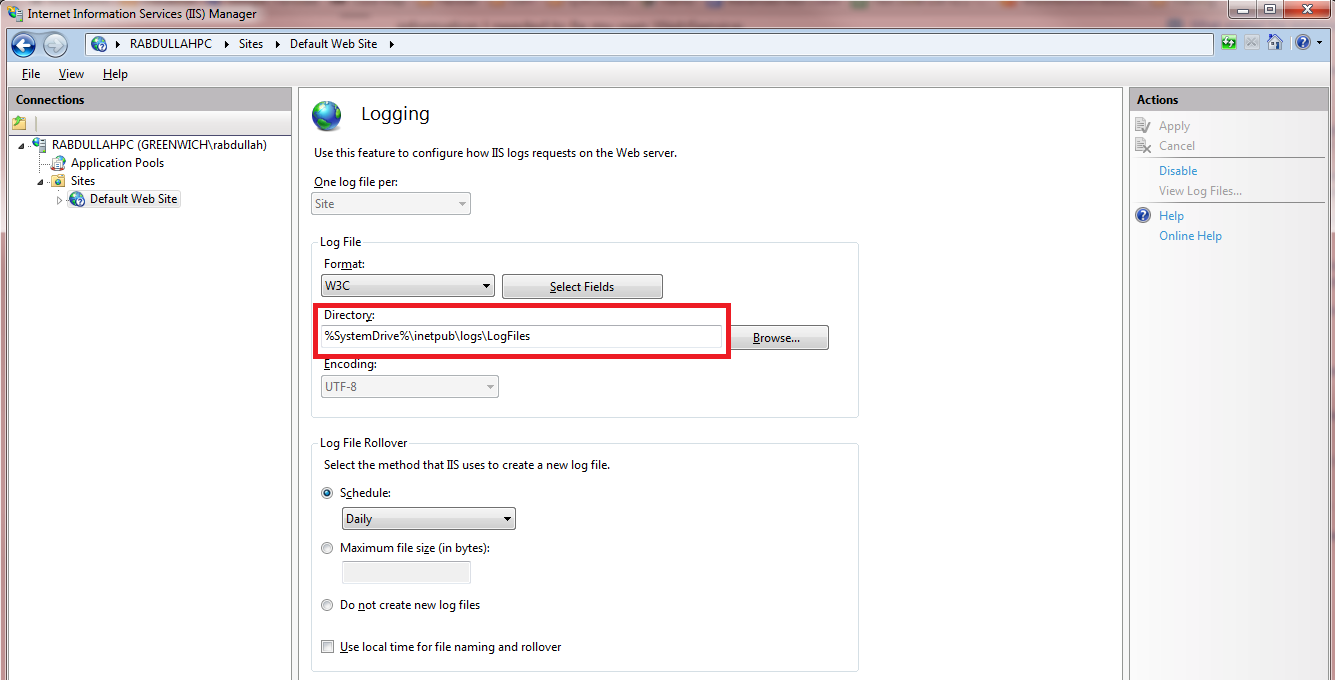
IIS Logs Location: On a standard Windows Server, IIS log files are found at %SystemDrive%\inetpub\logs\LogFiles by default.
What to do if you can’t find IIS Log files?
It’s not uncommon for administrators or other IT personnel to switch the directory where they’re stored if requirements change. In this instance, it’s essential that users are able to quickly find IIS log files to monitor the health of applications, troubleshoot them, or find basic information for cyber security and data governance concerns.
Centralize IIS logs with Sumo Logic today
See how you can monitor and manage your IIS files
Unfortunately, how to look up log files varies depending on which version of IIS is used. By following very specific steps for the different versions of IIS deployed, users can find log files.
How to Find IIS Log Files on IIS 7 and Later
How to Find IIS Log Files on IIS 6 and Earlier
How to Find IIS Log Files on Azure
3 Benefits of Centralizing IIS Log Files into a Unified View
IIS log files are saved in many different directories and locations. They’re stored in different places based on the various versions of IIS organizations use.
It’s not uncommon for individual departments and business units to have different versions of IIS within an organization. Additionally, the various cloud offerings of IIS save its log files in different places, which adds to the complexity of managing these files for troubleshooting and monitoring web based applications.
Organizations can maximize the value of IIS log files by centralizing them into a unified dashboard that works across versions of IIS and hybrid cloud settings. This approach has several benefits, including:
1. IIS Log File Comparisons
A single dashboard for viewing IIS log file metrics makes it easy to check IIS log files and allows for quick comparisons between applications and their performances. Organizations can determine how a spike in the use of one application affects the performance of another and other networking concerns.
It’s much more difficult to readily compare metrics and identify trends in app use and performance when the IIS log data is stored in different places. Intuitive graphics such as pie charts, bar diagrams, and others simplify comparisons to show the most insightful information produced by IIS log files
2. Real-Time Analytics of IIS Logs
A centralized dashboard for looking at IIS log files is great for some of the advanced, real-time analytics that help give this type of data both immediate and long term value. Organizations can determine trends as they’re happening, or even accurately predict trends with machine learning analytics.
The overall impact is greater responsiveness and enterprise agility for managing web based applications.
Real-time analytics of IIS log file data can also play an important role in monitoring cyber security issues, helping to decrease the number of data breaches and amount of damage they cause.
3. Continuous Monitoring and Alerts of IIS Logs
Assembling IIS log files into a single dashboard is critical for continuously monitoring this data, which is particularly important with ongoing, event-based data typical of many web applications. It’s much more practical to implement this continuous monitoring of IIS log files when they’re centralized in a uniform dashboard than when they’re spread out over different directories and locations.
Centralizing IIS log files for continuous monitoring is also helpful for issuing alerts to create action from this information. With a single view of IIS log files, alerts are not only based on individual applications and factors, but also on combinations of them. The action coming from alerts is more effective when it is based on continuously monitoring all IIS log files.
Centralize IIS logs with Sumo Logic today
See how you can monitor and manage your IIS files
How to Centralize IIS Log Files to Find Them Easily
The Sumo Logic App for IIS provides each of these centralizing benefits and more. This app is a sophisticated IIS log analysis tool leveraging user friendly dashboards to give organizations one place to monitor and manage all of these files.
The reality is organizations must manage their IIS log data to see how their web based applications are performing, maintain their health, and reinforce aspects of cyber security and data governance. It’s essential for businesses to learn more about how IIS log data can help both those applications and their businesses as a whole.
Additional IIS Log File Resources
Centralize IIS logs with Sumo Logic today
See how you can monitor and manage your IIS files
Configure Logging in IIS
by Keith Newman and Robert McMurray
You can configure logging on your web server or website that records information about HTTP requests and errors. The information in your log can help you troubleshoot or optimize your website.
Prerequisites
To get the most from this tutorial, you must have access to a computer that is running one of the following operating systems:
Configure Logging at the Site Level
You can perform this procedure by using the user interface (UI), or by editing configuration files directly.
To configure logging at the site level by using the UI
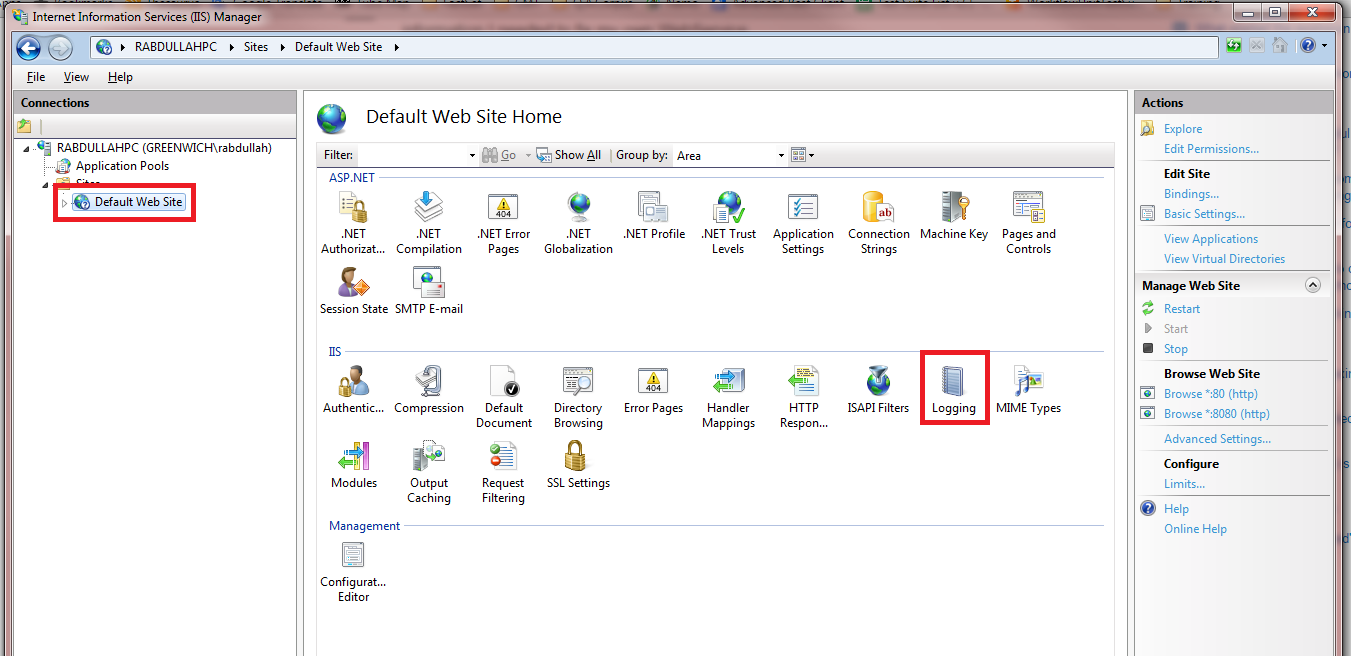
In the Connections tree view, select your website.
In Features View, double-click Logging.
On the Logging page, in the Log file section under Format, select one of the following log file formats:
In the Log File Rollover section, select one of the following options:
Schedule: to create new log file that is based on one of the following values:
Maximum file size (in bytes): to create a log file when the file reaches a certain size (in bytes).The minimum file size is 1048576 bytes. If this attribute is set to a value less than 1048576 bytes, the default value is implicitly assumed as 1048576 bytes.
Do not create a new log file: there is a single log file that continues to grow as information is logged.
Select Use local time for file naming and rollover to specify that log file naming and time for log file rollover uses the local server time. When this option is not selected, Coordinated Universal Time (UTC) is used.
Regardless of this setting, timestamps in the actual log file will use the time format for the log format that you select from the Format list. For example, NCSA and W3C log file formats use UTC time format for timestamps.
Click Apply in the Actions pane.
Configure Per-site Logging at the Server Level
You can perform this procedure by using the user interface (UI), or by editing configuration files directly.
To configure per-site logging at the server level by using the UI
In the Connections tree view of IIS Manager, select your web server.
In Features View, double-click Logging.
On the Logging page under One log file per site, select Site from the drop-down list. By default, Site is selected.
On the Logging page, in the Log file section under Format, select one of the following log file formats:
In the Log File Rollover section, select one of the following options:
Schedule: to create new log file that is based on one of the following values:
Maximum file size (in bytes): to create a log file when the file reaches a certain size (in bytes).The minimum file size is 1048576 bytes. If this attribute is set to a value less than 1048576 bytes, the default value is implicitly assumed as 1048576 bytes.
Do not create a new log file: there is a single log file that continues to grow as information is logged.
Select Use local time for file naming and rollover to specify that log file naming and time for log file rollover uses the local server time. When this option is not selected, Coordinated Universal Time (UTC) is used.
Regardless of this setting, timestamps in the actual log file will use the time format for the log format that you select from the Format list. For example, NCSA and W3C log file formats use UTC time format for timestamps.
Click Apply in the Actions pane.
Configure Per-server Logging at the Server Level
You can perform this procedure by using the user interface (UI), or by editing configuration files directly.
To configure per-server logging at the server level by using the UI
In the Connections tree view of IIS Manager, select your web server.
In Features View, double-click Logging.
On the Logging page, under One log file per site, select Server from the drop-down list. By default, Site is selected.
On the Logging page, in the Log file section under Format, select one of the following log file formats:
In the Log File Rollover section, select one of the following options:
Schedule: to create new log file that is based on one of the following values:
Maximum file size (in bytes): to create a log file when the file reaches a certain size (in bytes).The minimum file size is 1048576 bytes. If this attribute is set to a value less than 1048576 bytes, the default value is implicitly assumed as 1048576 bytes.
Do not create a new log file: there is a single log file that continues to grow as information is logged.
Select Use local time for file naming and rollover to specify that log file naming and time for log file rollover uses the local server time. When this option is not selected, Coordinated Universal Time (UTC) is used.
Regardless of this setting, timestamps in the actual log file will use the time format for the log format that you select from the Format list. For example, NCSA and W3C log file formats use UTC time format for timestamps.
Click Apply in the Actions pane.
Select W3C Fields to Log
You can perform this procedure by using the user interface (UI), or by editing configuration files directly.
To select W3C fields to log by using the UI
In Features View of IIS Manager, double-click Logging.
On the Logging page, in the Log file section under Format, click Select Fields.
In the W3C Logging Fields dialog box, select one or more of the following options:
Click Apply in the Actions pane.
Configure Log File Rollover Options
You can perform this procedure by using the user interface (UI), or by editing configuration files directly.
To configure log file rollover options by using the UI
In Features View of IIS Manager, double-click Logging.
On the Logging page, in the Log File Rollover section, select one of the following options:
Schedule: to create new log file that is based on one of the following values:
Maximum file size (in bytes): to create a log file when the file reaches a certain size (in bytes).The minimum file size is 1048576 bytes. If this attribute is set to a value less than 1048576 bytes, the default value is implicitly assumed as 1048576 bytes.
Do not create a new log file: This option means that there is a single log file that continues to grow as information is logged. If you use a single log file for your site, it is helpful when you use log parsing utilities, but it also creates larger log files that could affect the overall performance of the server.
Select Use local time for file naming and rollover to specify that log file naming and time for log file rollover uses the local server time. When this option is not selected, Coordinated Universal Time (UTC) is used.
Regardless of this setting, timestamps in the actual log file will use the time format for the log format that you select from the Format list. For example, NCSA and W3C log file formats use UTC time format for timestamps.
Click Apply in the Actions pane.